As educators, understanding how students engage with course materials is key to creating meaningful learning experiences. Learning analytics provides instructors a powerful toolset to collect and analyze data on student engagement, providing actionable insights that can help tailor teaching strategies and improve student outcomes. In Brightspace, various built-in tools allow instructors to track student progress, identify engagement trends, and assess the effectiveness of course materials.
What is Learning Analytics?
According to the Society for Learning Analytics Research (SoLAR), learning analytics is “the measurement, collection, analysis, and reporting of data about learners and their contexts, for purposes of understanding and optimizing learning and the environments in which it occurs.” Learning analytics involves the collection and analysis of data about learners and their educational experiences. It focuses on using this data to understand and optimize both the learning outcomes and the environment in which learning takes place.
Learning Analytics Tools in Brightspace
Brightspace provides a variety of analytics tools that give instructors a comprehensive view of student engagement. These tools help faculty understand how students interact with assignments, discussions, quizzes, and more.
Click on the screenshots for sample data
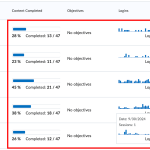
- Class Progress: This tool provides a customizable dashboard that allows you to monitor both class-wide and individual student progress across a variety of metrics, such as assignments, discussions, quizzes, and content access. You can select up to four metrics from a list of seven, including assignment performance, content completion, discussion participation, and quiz performance. This feature gives you a high-level view of student activity and enables you to intervene when needed.
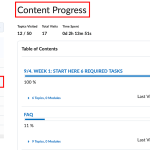
- Content Reports: Content reports provide insights into how students interact with course materials. You can view data on how many students have accessed specific content items, how often they visit them, and how much time they spend viewing them. This helps you determine which materials are most engaging and which may need adjustment.
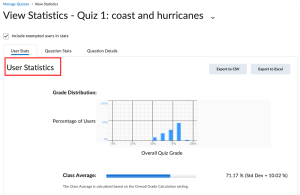
- Quiz Statistics: Brightspace’s quiz statistics give a detailed breakdown of quiz performance, allowing you to see class averages, standard deviations, and individual student results. You can also dive deeper into individual quiz questions to understand how students are performing on specific topics.
- Discussion Statistics: Track student activity in discussion forums with Brightspace’s discussion statistics. This tool provides data on overall discussion participation, individual student contributions, and activity within specific forums or topics, helping you gauge how students engage with each other and the course material.
- Gradebook Statistics: Gradebook statistics offer a detailed view of student performance in different grade items or categories. You can filter the data by sections or individual users to get a clear picture of how students are progressing in the course.
- Custom Reports and Intelligent Agents: Brightspace also allows you to create custom reports through Intelligent Agents, which are triggered based on specific conditions like assignment scores or login activity. For example, if a student scores below a certain threshold on a quiz, the Intelligent Agent can automatically send them extra resources or schedule a follow-up to help them catch up.
How Learning Analytics Improves Teaching
By using these analytics tools, instructors gain valuable insights into student engagement and can make informed decisions about how to improve their courses. Here are some ways learning analytics can enhance your teaching:
- Identify Strengths and Weaknesses: Analytics tools allow you to see which assignments, quizzes, or content sections are resonating with students and which ones may need refinement. By identifying these patterns, you can adjust your teaching approach or course materials to better support learning.
- Monitor Engagement Levels: These tools make it easier to pinpoint where students are engaged or disengaged. If a particular discussion topic or quiz isn’t receiving enough attention, you can explore ways to make it more interactive or provide additional support.
- Provide Personalized Support: With real-time data on student performance and engagement, you can offer targeted interventions for students who may be falling behind or struggling with specific topics. This can be as simple as sending additional resources or setting up one-on-one meetings to discuss challenges.
- Optimize Course Design: Regularly reviewing learning analytics helps you refine your course design based on actual student behavior. If a large portion of the class consistently struggles with a particular topic or assignment, you can modify the structure to make the material more accessible.
Conclusion
Brightspace’s learning analytics tools give instructors the data they need to make informed decisions that improve student engagement and outcomes. By using these tools, faculty can move beyond basic assessments and get a real-time view of how students are interacting with the course. This enables educators to provide more personalized support, refine course materials, and create a more effective and inclusive learning environment.
For detailed how-to steps in Brightspace, please check out this guide. For more information on how to leverage Brightspace’s learning analytics, reach out to the IT Teaching and Learning Services team at its.uri.edu/tls or attend one of our upcoming training sessions.


